How to see the value and type of any variable, field, property or element in Visual Studio
05 May 2021
Visual Studio is chock-full of various debugging functions, windows and panels. And they are pretty good at what they can do. However, this abundance of tools and options often leads to a cognitive overload – how the hell are you supposed to know which one to use when?
There is one particular function, however, that has proven to be most useful when finding and fixing bugs, or doing any sort of prototyping or testing of new ideas. If I had to name my favourite tool in the VS debugging chest, it would be the QuickWatch window.
Let’s see how it can help you save lots of time and guesswork when debugging and developing apps.
Nothing works no more!
You’re probably familiar with at least one of the following situations: your app was working just fine yesterday, but right now it’s blowing up with a cryptic exception or error. Or perhaps you’re looking at the code that you wrote a month ago and can’t remember any of it, or not even able to understand what the hell it’s doing. Or maybe you’ve just copy-pasted somebody else’s code from Stack Overflow and it doesn’t work.
In all of those situations, you’re going to need to debug your app to see what it is doing:
- how the execution flow is progressing (i.e. which lines of code run when)
- how conditional logical operators (
if ... then,do ... while,switch ... caseetc) are behaving - what are the values in local, class-level and global variables
And that’s where the QuickWatch functionality of Visual Studio comes in particularly handy.
Start debugging
Before you can see the values of variables in your app, you’ll need to start the app in Debugging mode. Depending on the type of your app, the setup may be slightly different, but the general order of steps would be:
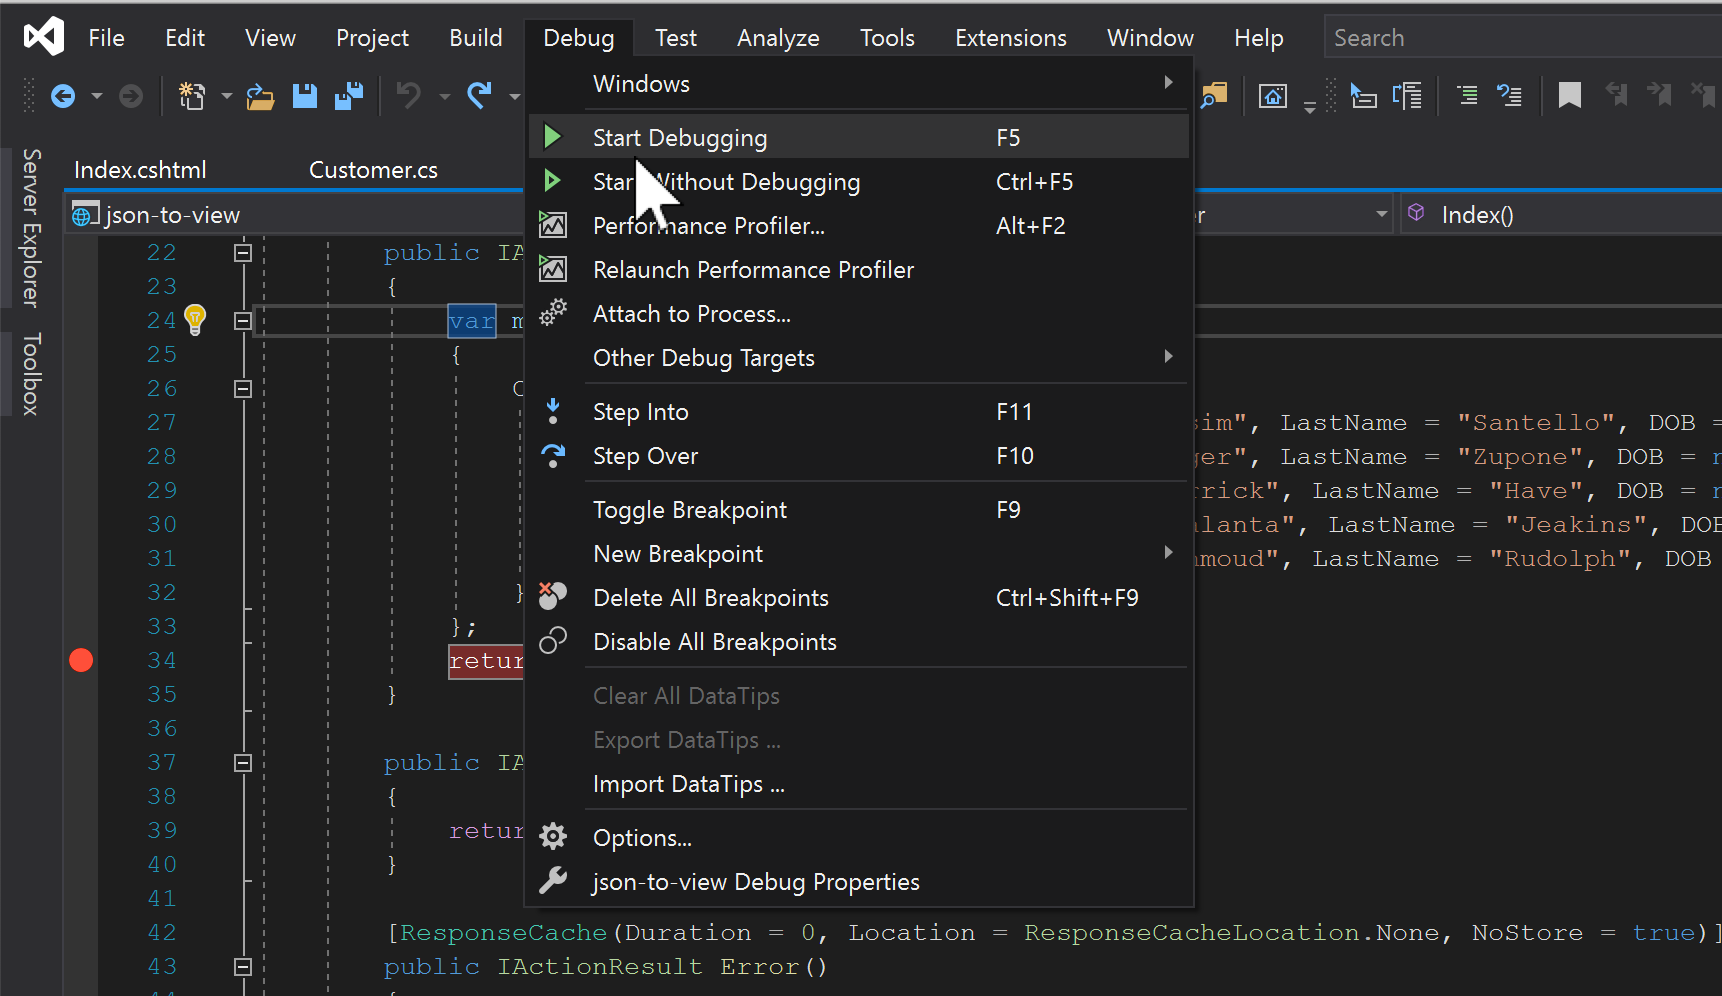
1. Set a breakpoint on a line in the method that you’re interested in
To do that, position your cursor on that line and press F9. Alternatively, you can click on the
left-hand side, just to the left of the line numbers. You should see a red dot appearing, and the
background colour of the corresponding line of code will change to red.
2. Start your app in the debugging mode
To do that, press F5 or select Debug -> Start Debugging from the VS menu. This will start your
app.
3. Get the breakpoint hit
If you set your breakpoint in the application startup logic, such as Main() method of a Console
App or in one of your Startup.cs methods in a Web App, it will get hit automatically, and the
execution will stop, awaiting your input. But if you set a breakpoint a specific method, you
will need to interact with your app to get the app to call that method.
For instance, if you’re debugging a user registration logic, you’ll need to submit that user registration page first for the execution flow to reach your breakpoint.
How to view a local variable
To view a local, or also called “method-level” variable, do this:
- Select the variable you’re interested in
- Press
Ctrl-Alt-Q.
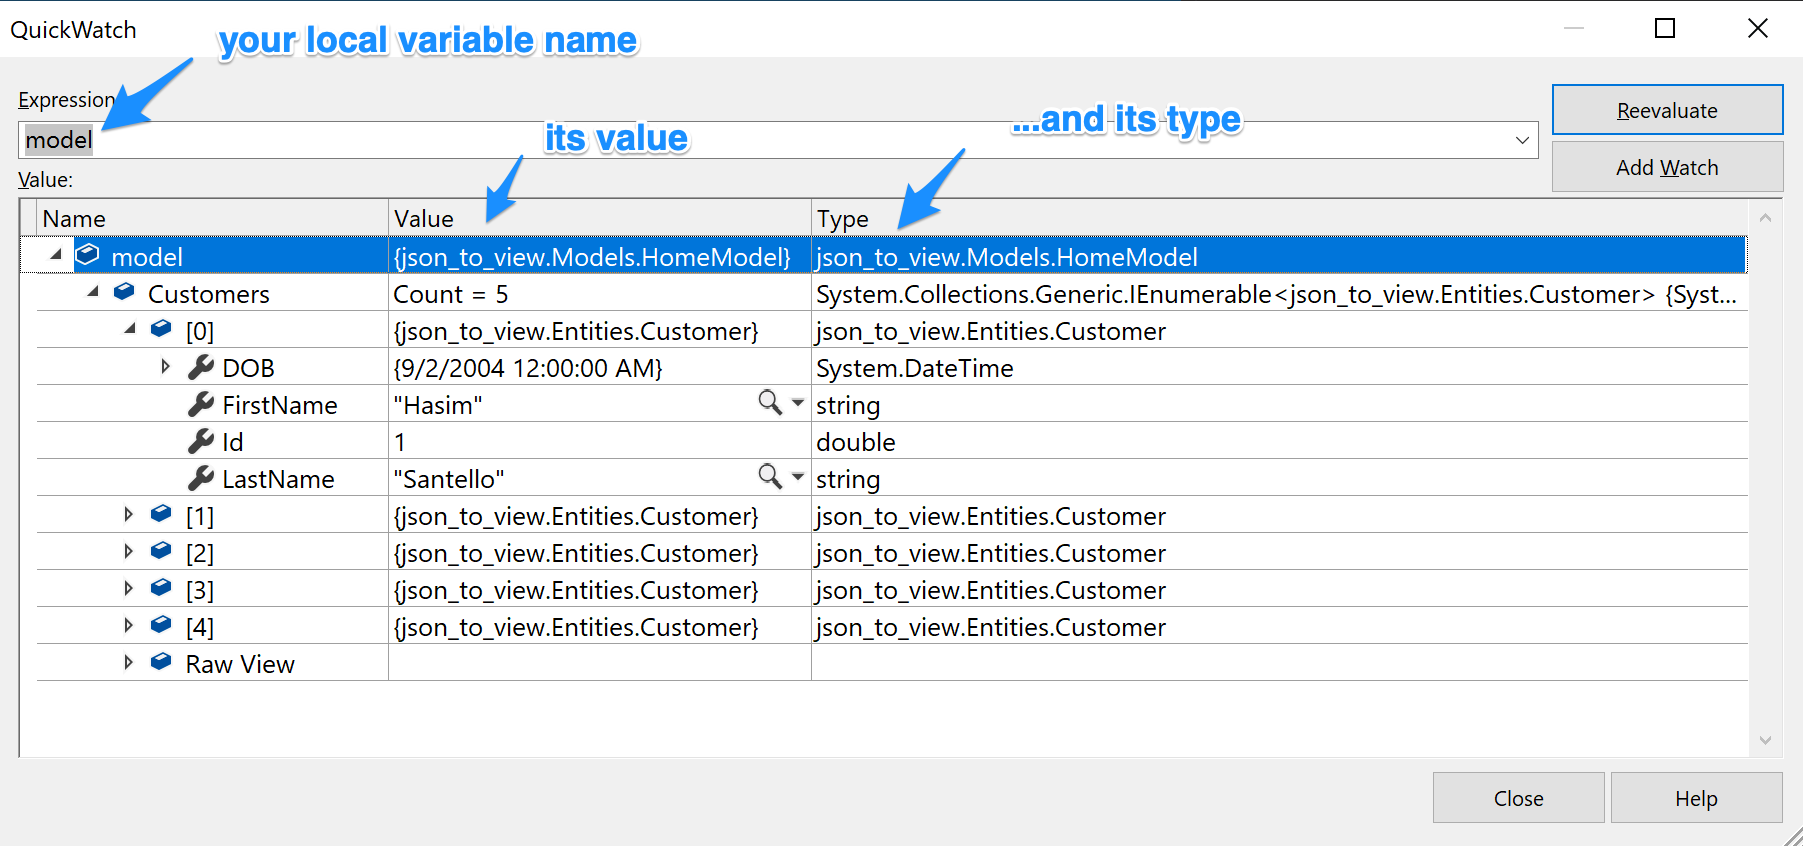
A QuickWatch window like in the picture above will appear. There’s a lot of stuff in this window, so let’s unpack it:
- In the text box, you see the variable you selected. You can delete the text and enter anything you want there – as long as it’s a valid C# expression, QuickWatch will evaluate it.
Namecolumn: contains the name of your variable and all its fieldsValuecolumn: the actual value of the variable, hooray! For things like arrays, lists and dictionaries, you’ll have to dig a bit deeper – to see the values contained within them, expand the list.Typecolumn: shows the fully-qualified class name. Very useful when you want to refactor your code and extract functions that deal with specific variables, for which you need to know the type.
How to view a class-level variable
Remember how I said you can enter any valid C# expression that returns a result into QuickWatch?
This is exactly how you get access to class-level fields and properties: start typing this. and an
auto-suggest menu will pop up:
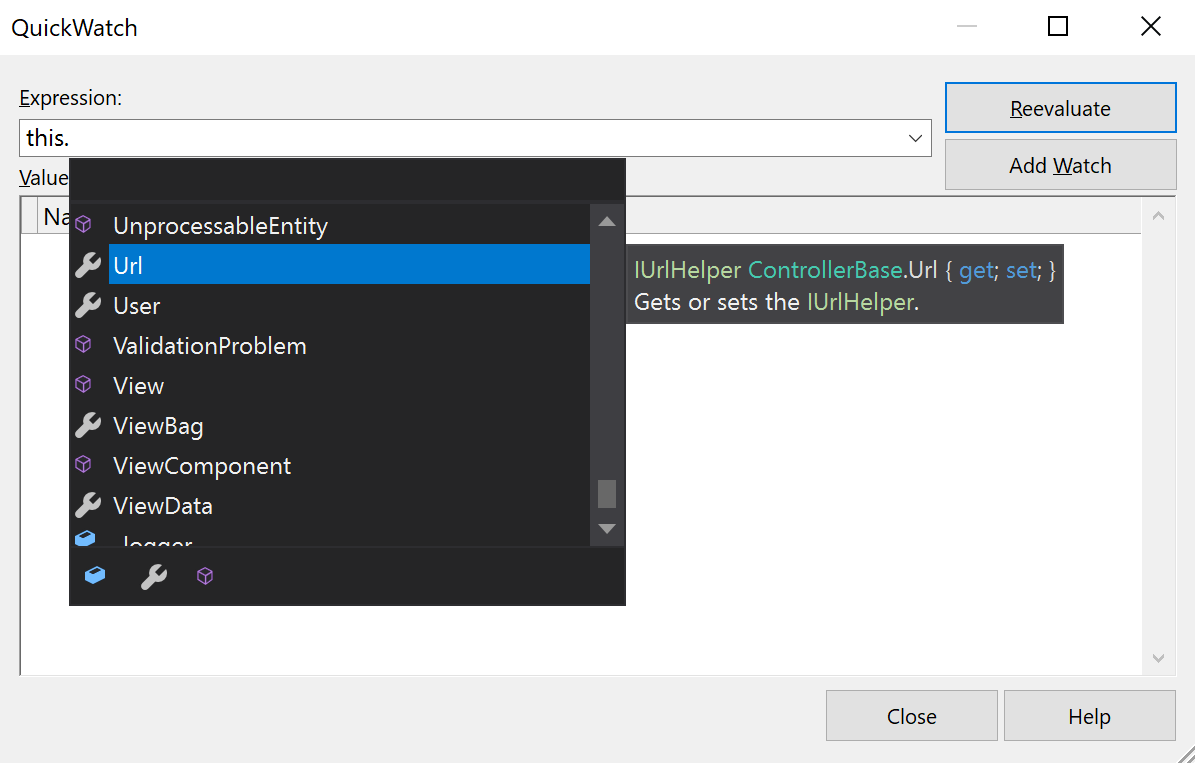
Select any field, property, or, heck, even call a function! QuickWatch will evaluate the expression and display the result.
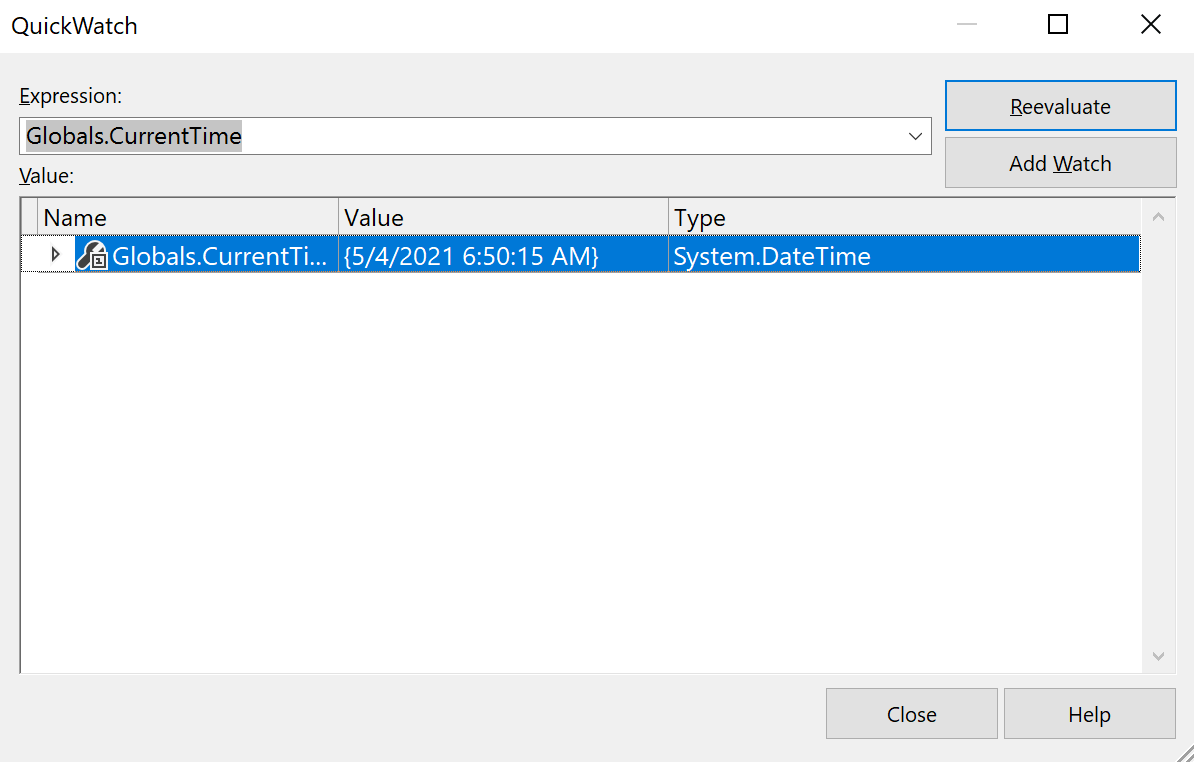
How to view a static/global variable
Let’s say you have a global class that you use for something. I wouldn’t advise to do this, but there are a few reasons you may have one, however it’s not the main poiunt of this article. For argument’s sake, let’s say you just have one.
public static class Globals
{
    public static DateTime CurrentTime
    {
        get
        {
            return DateTime.UtcNow;
        }
    }
}
Then you can view that static property in the QuickWatch in the following manner:
Conclusion
I hope you found this article useful and learnt how to inspect various types of data using the Visual Studio QuickWatch tool.
If you found this article useful – sign up to my mailing list to get more helpful tips and advice on all things .NET Core and C# development. I never spam or share your details with anyone, and you can unsubscribe at any time.